A Stanford University Data Science Capstone Project (2025)
Authors: Michelle Chen, Sebastian Kane, and Larissa Lauer
Introduction
EdTrust’s mission is to advance policies and practices to dismantle the racial and economic barriers embedded in the American education system. We approached our research project with the goal of examining larger systemic issues with American higher education.
Return on investment (ROI) frameworks inform educational policies and help prospective students and their families plan for higher education, so the way in which ROI is calculated and presented is extremely important in determining which institutions receive more or less funding, resources, and students. Current ROI frameworks largely focus on a purely economic model (most often, a debt-to-earnings ratio), which neglects student body characteristics that also influence post-graduate success.
Our research fills a critical gap in existing ROI frameworks by specifically examining how the calculation of ROI changes for Minority-Serving Institutions (MSIs) and Predominantly White Institutions (PWIs) when controlling for key student body characteristics. Traditional models assess ROI at the institutional or program level but often overlook how institutional type intersects with student demographics, socioeconomic status, and structural barriers like labor market discrimination. By integrating factors like student body characteristics into our analysis, we aim to determine whether disparities in ROI persist due to institutional differences or broader systemic inequities. Our refined approach provides a more accurate and equitable measure of postsecondary value, ensuring a fairer assessment of institutions that serve historically underrepresented students. Our findings would not only sharpen ROI calculations but also inform policy debates on funding and resource allocation between MSIs and PWIs.
Methods
We primarily relied on College Scorecard data to construct this dataset and calculate the measures of ROI. For the median state salary of high school graduates, we used a dataset from Third Way. For each of the ROI frameworks, we based our implementation on a combination of the original institution’s documentation and, when necessary, precedent set by EdTrust. The specific calculation for each framework is documented in each section.
For our data analysis, we used a combination of R and Python in Deepnote, which allowed us to collaborate on notebooks and share figures we created.
For each framework, we first ran an ordinary least squares (OLS) regression model to measure the relationship between MSI type and ROI. We consider the following MSI designations provided by College Scorecard:
- Historically Black College or University (HBCU)
- Predominantly Black Institution (PBI)
- Alaska Native-/Native Hawaiian-Serving Institution (ANNHI)
- Tribal College or University (TRIBAL)
- Asian American-/Native American-Pacific Islander-Serving Institution (AANAPII)
- Hispanic-Serving Institution (HSI)
- Native American Non-Tribal Institution (NASNTI)
We present the model results in plots that show the coefficient for each variable (in this case, each MSI type) and the associated 95% confidence interval. We also tested the appropriateness of each model and used robust standard errors where relevant, though we omit detailed discussion for brevity. Because our analysis draws on a comprehensive dataset of all U.S. colleges rather than a sampled subset, effect sizes are more meaningful than confidence intervals in interpreting the results. For OLS models in which ROI is regressed on the MSI variables, each coefficient can be interpreted as the expected ROI for attending a given MSI type above the expected ROI for attending a non-MSI school. A positive effect, therefore, indicates that an MSI type performs better than non-MSIs on average, and a negative effect indicates worse average performance.
We then ran that same model but included an additional variable for the percentage of students at an institution that receive a Pell Grant, which is a proxy for the student body’s general socioeconomic status. The coefficient for Pell Grant percentage can be interpreted as the expected increase in ROI for a one percent increase in the percentage of students receiving Pell Grants, holding other variables constant. We are particularly interested in the difference between the Pell Grant and non-Pell Grant models. If the coefficients for MSI variables shift between models, this would suggest that some of the apparent differences in ROI associated with MSI status might actually be due to differences in the economic background of students.
We also considered student body race and ethnicity variables instead of MSI type indicators. Because the classification of schools into different MSI types is based on the percentage of students from certain backgrounds (generally ≥ 25%, except for HBCUs & TCUs), it may be more informative to use demographic percentages rather than simplified dichotomous variables. These variables can better incorporate the continuous variation in student body composition across institutions and provide a more nuanced understanding of how demographic features relate to ROI. We used the following demographic variables: Black %, Hispanic %, Asian %, AIAN % (American Indian or Alaska Native), and NHPI % (Native Hawaiian or Pacific Islander). Similar to Pell percentage, coefficients can be interpreted as the expected increase in ROI for a one percent increase in the percentage of students of a given race/ethnicity at a school, controlling for the other variables.
Because the racial percentages sum to approximately 100%, including all racial percentage variables leads to high multicollinearity and inestimable parameters. Intuitively, the effect of a given racial percentage on ROI is not interpretable if all race variables are included because controlling for these other variables effectively constrains the movement of the variable of interest to nothing. As such, we do not use percent White as a variable, and the effect of other race variables can be interpreted as being relative to the effect of this omitted percent White variable. Likewise, the effect of the percent Hispanic variable can be interpreted relative to the effect of an omitted percent non-Hispanic variable. This same logic explains why the estimates of the MSI model are interpretive relative to non-MSI schools.
Besides simple regression analysis, we also performed logit regression for the Postsecondary Value Commission framework to model whether a school meets an ROI threshold as a function of Pell percentage, MSI type, and race/ethnicity percentages. We chose to conduct logit regression as it is better suited for the binary-based interpretation of a threshold. While these threshold-based approaches offer a straightforward way to evaluate institutional performance, they simplify the continuous ROI metrics into binary outcomes, potentially masking meaningful differences across schools. For this reason, we prioritize the OLS results and recommend against overly relying on dichotomous variables when analyzing ROI.
Interpretation of coefficients for logit models is less straightforward than with OLS models. They now represent the log odds of a school meeting the threshold. To provide some intuition for interpreting these log odds, we outline how different log-odd values translate into odds. A log odds of 0 corresponds to a 50/50 chance of meeting the threshold. 0.2 corresponds to about a 5:4 odds of meeting the threshold, and -0.2 to about a 4:5 odds. Similarly, 0.4 corresponds to about a 3:2 odds, and -0.4 to about a 2:3 odds. We chose to create plots of log-odds rather than odds because it is more standard across the literature, and log-odds are symmetric around 0, unlike odds, which range from 0 to 1 for probabilities less than 50% and 1 to infinity for probabilities greater than 50%.
How to Use This Dataset
The following dataset provides information on the ROI of colleges and universities in the United States for each framework of interest. We include other relevant variables, such as the percentage of students receiving Pell Grants (an indicator of socioeconomic status), MSI type, and racial demographics. We primarily relied on College Scorecard data to construct this dataset and calculate the measures of ROI.
You can sort the columns of this table in ascending order and descending order to see which institutions have the most extreme values. If you are interested in recreating or further developing our regression analysis, click “Download Dataset” below the table to save a copy of it to your device.
Prospective students and parents may also be interested in the ROI of specific schools. These schools can also be found using the search bar. See the discussion below for details on interpreting specific ROI frameworks.
We want to caution against blindly relying on ROI measures as indicators of a school’s quality or of the return a student should expect from attending. Indeed, a central finding of our research is that existing ROI frameworks can conflate the individual return on investment a student can realistically expect with the advantages already conferred by their socioeconomic background. In other words, a high ROI may indicate that an institution effectively contributes to student success and career outcomes or that its student body comes from backgrounds that often lead to higher earnings regardless of the institution attended. In the absence of detailed individual-level data on earnings, background, and college of attendance, more work is needed to produce informative and accurate measures of ROI that do not rely on questionable assumptions.
Third Way's Price to Earnings Premium (PEP) Model
Calculation Framework
Third Way’s Price-to-Earnings Premium (PEP) Model is a way to understand whether going to a specific college is worth the cost, by calculating how long it would take for the average student who graduates in 4 years to recoup, or “earn back” the money they spent on their degree. For some schools, the average student is never expected to recoup the cost of their degree, because graduates don’t make more money than the average high school graduate in their state; in other words, students from these schools make the same amount of money with their degree as they would have had they never graduated college in the first place.
The original calculation, created by Third Way, uses the following formula:
$$\textbf{Number of years to recoup net cost} = \frac{(\text{Total average net price} \times 4 \text{ years})}{(\text{Post-enrollment earnings} - \text{Typical high school salary})}$$
This calculation results in negative results for institutions where the typical salary of a graduate from that institution is less than the typical salary of a high school graduate in the same state. Therefore, if an institution has a negative PEP-ROI score, the average graduate of this institution will never recoup the cost of their degree. The more negative the number, the larger the gap in earnings for graduates of the institution and high school graduates. If the institution has a positive PEP-ROI score, the value of the score translates to the number of years it would take the average student to recoup the cost of their credential.
For this analysis, we consider the “best value” schools to be ones where the cost of the credential is recouped quickly, in just a few years. This means that the strength of an institution’s PEP-ROI score increases as its number shrinks towards 0 years to recoup cost. However, that pattern changes at 0, since a PEP-ROI score less than 0 is a very weak score. This feature of Third Way’s original calculation of PEP-ROI scores makes it much harder to conduct statistical analysis of institutions’ ROI data.
To deal with this, we made an adjustment to the original formula. By taking the inverse of the PEP-ROI score (so 1 divided by the original score), we get scores such that an increase in modified PEP-ROI score translates to a “better value” for an institution. This solves the problem we were facing with the original PEP-ROI score because the interpretation of our modified PEP-ROI scores is consistent for both positive and negative values.
To recap, our modified calculation for PEP-ROI is:
$$\textbf{Modified PEP-ROI} = \frac{(\text{Post-enrollment earnings} - \text{Typical high school salary})}{(\text{Total average net price} \times 4 \text{ years})}$$
Relevant Variables
To build this model, we used data from two main sources:
College Scorecard Data (Institution-level data):
STABBR: The state where the college is located.MN_EARN_WNE_P10: Average earnings of college graduates 10 years after they started college.NPT4_PUB: Average yearly cost of attendance for public colleges.NPT4_PRIV: Average yearly cost of attendance for private colleges.
We multiplied the average yearly cost by 4 to estimate the full cost of a 4-year degree.
Third Way 2023 Data:
Median State Salaries with Positive Earnings (High School Diploma or Equivalent): This gives the typical income for high school graduates in each state, which we use for comparison.
Table of Results
Further Analysis of the PEP Model
Trends across Minority-Serving Institutions
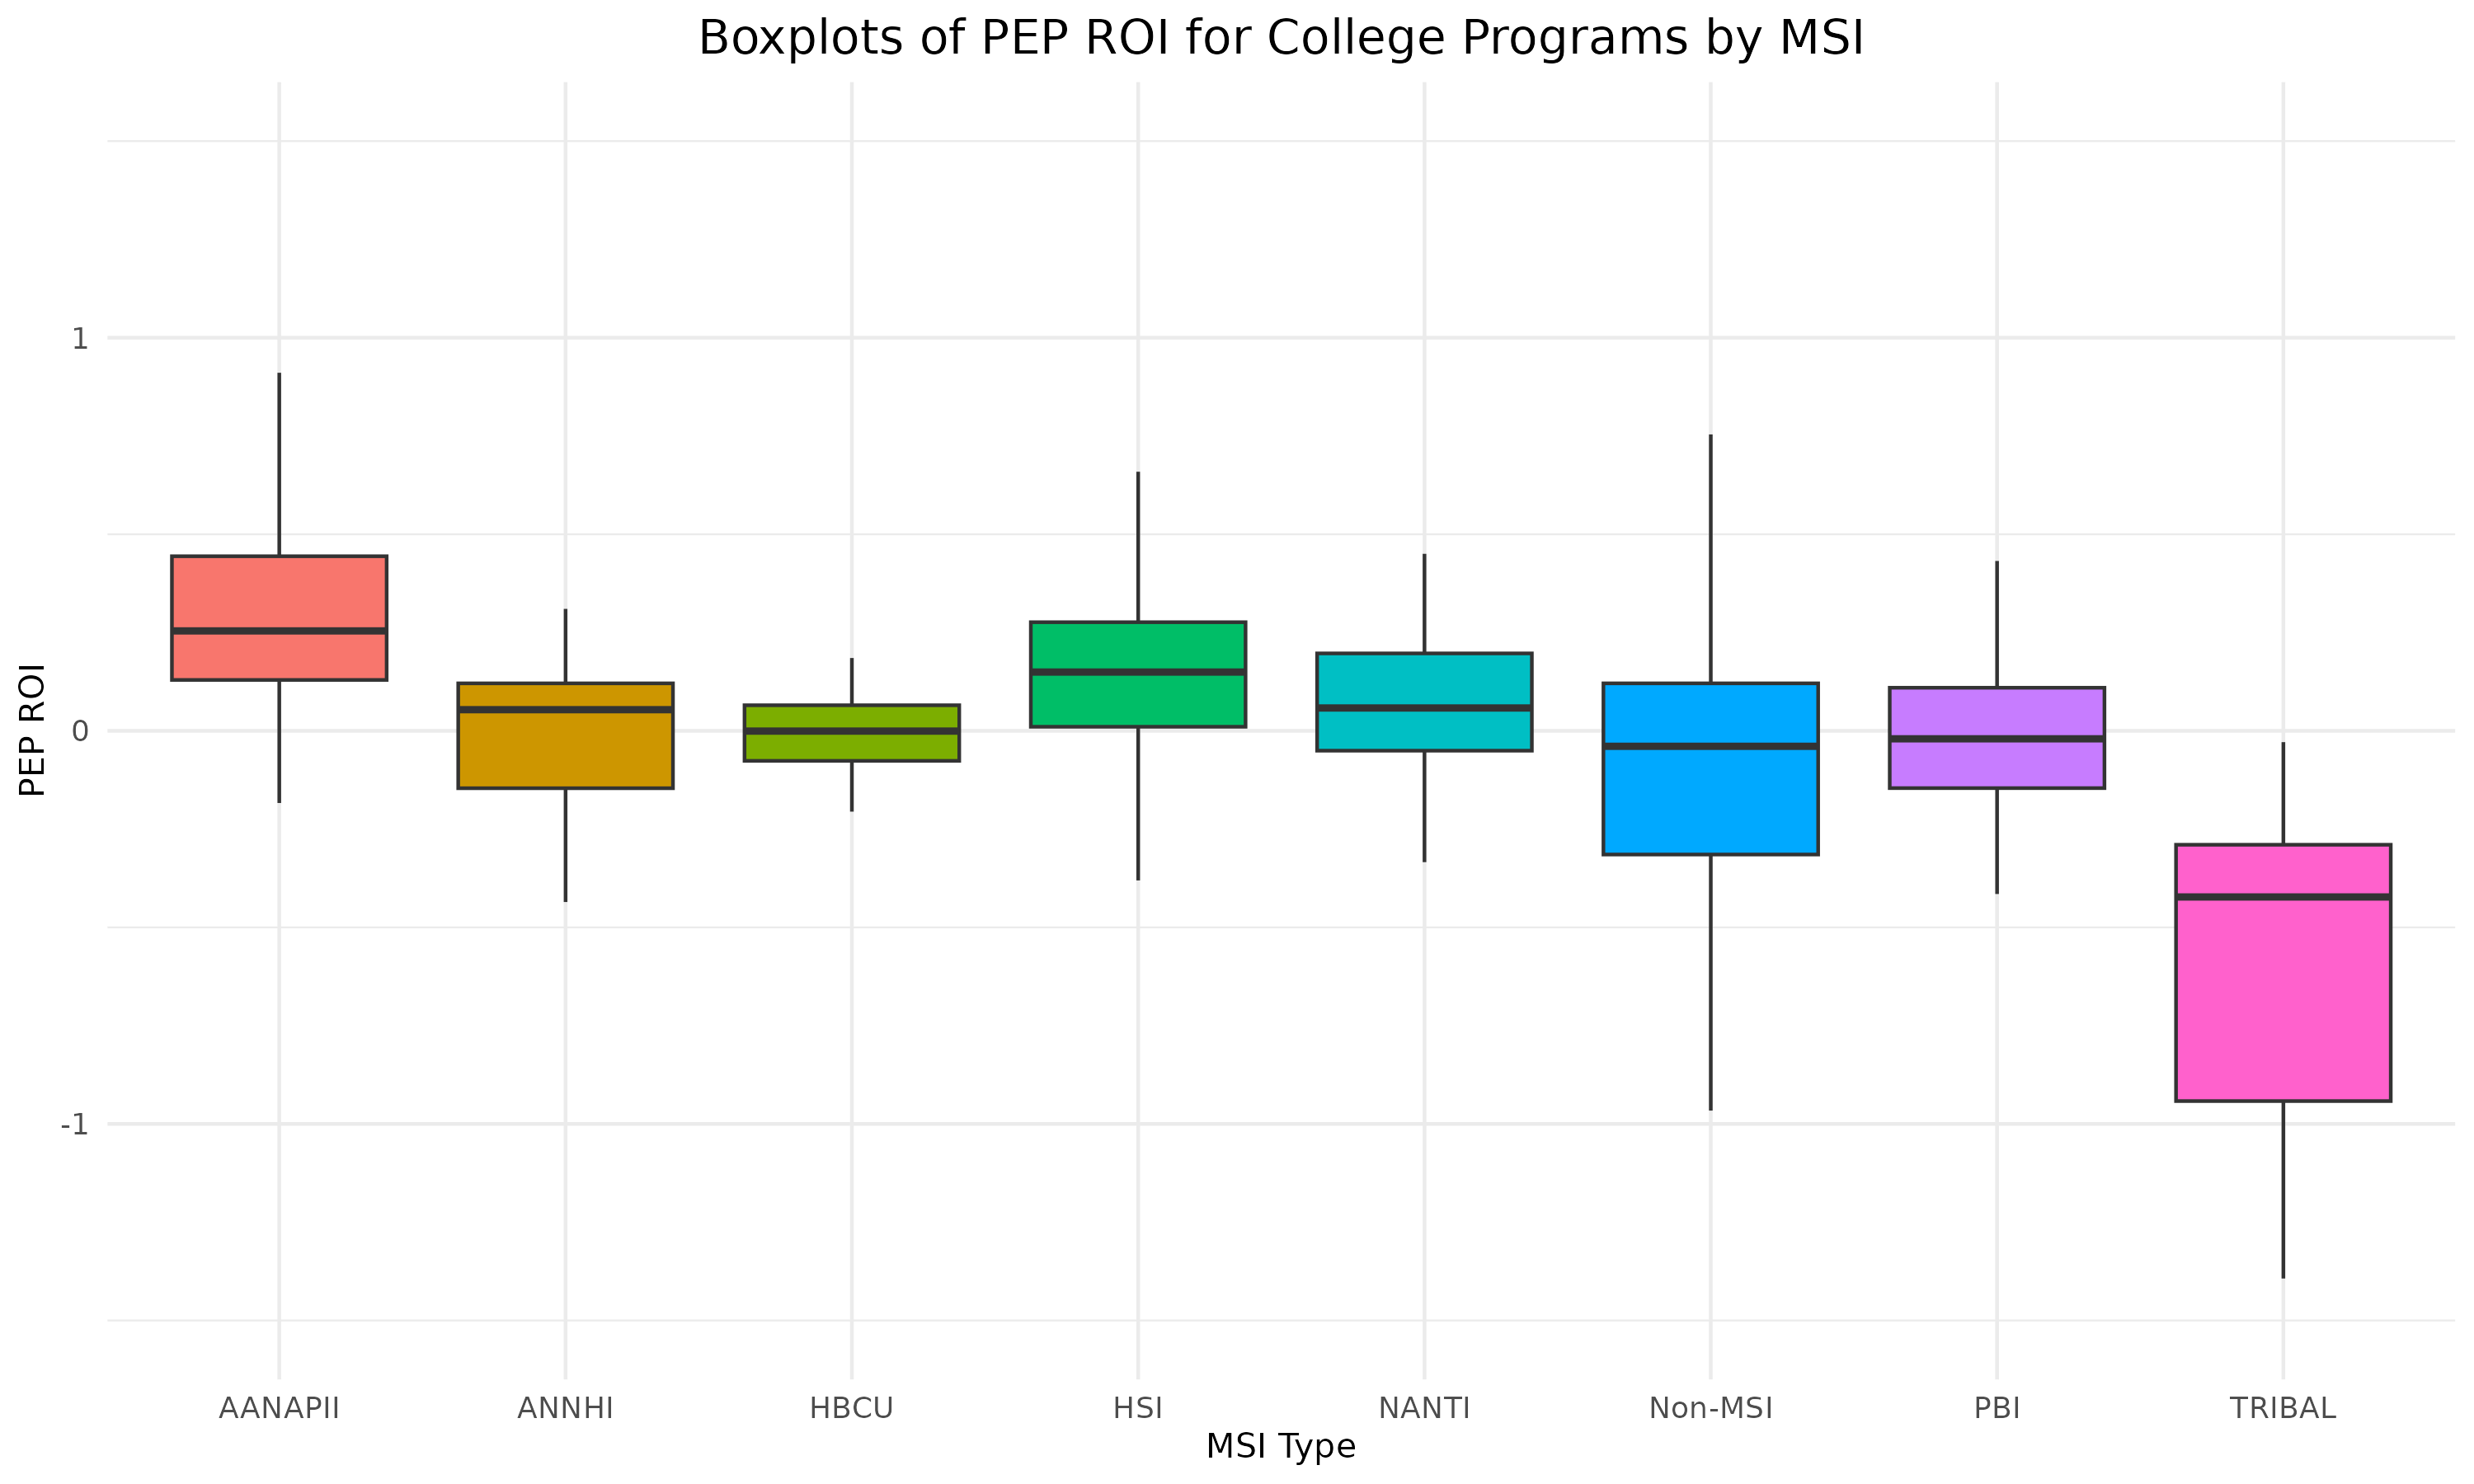
This boxplot (Figure 1) shows the distribution of PEP ROI values across different types of MSIs and Non-MSIs. Each box represents the interquartile range of PEP-ROI values for that group, with the thick horizontal line indicating the median.
Our findings:
- AANAPII and HSI institutions tend to show slightly positive median PEP-ROI values, indicating better returns compared to others.
- TRIBAL colleges show a notably lower distribution, with a median well below zero, suggesting significantly lower PEP-ROI performance.
- Non-MSI schools center closer to zero, with a broader distribution indicating varied outcomes.
Trends across Demographic Groups
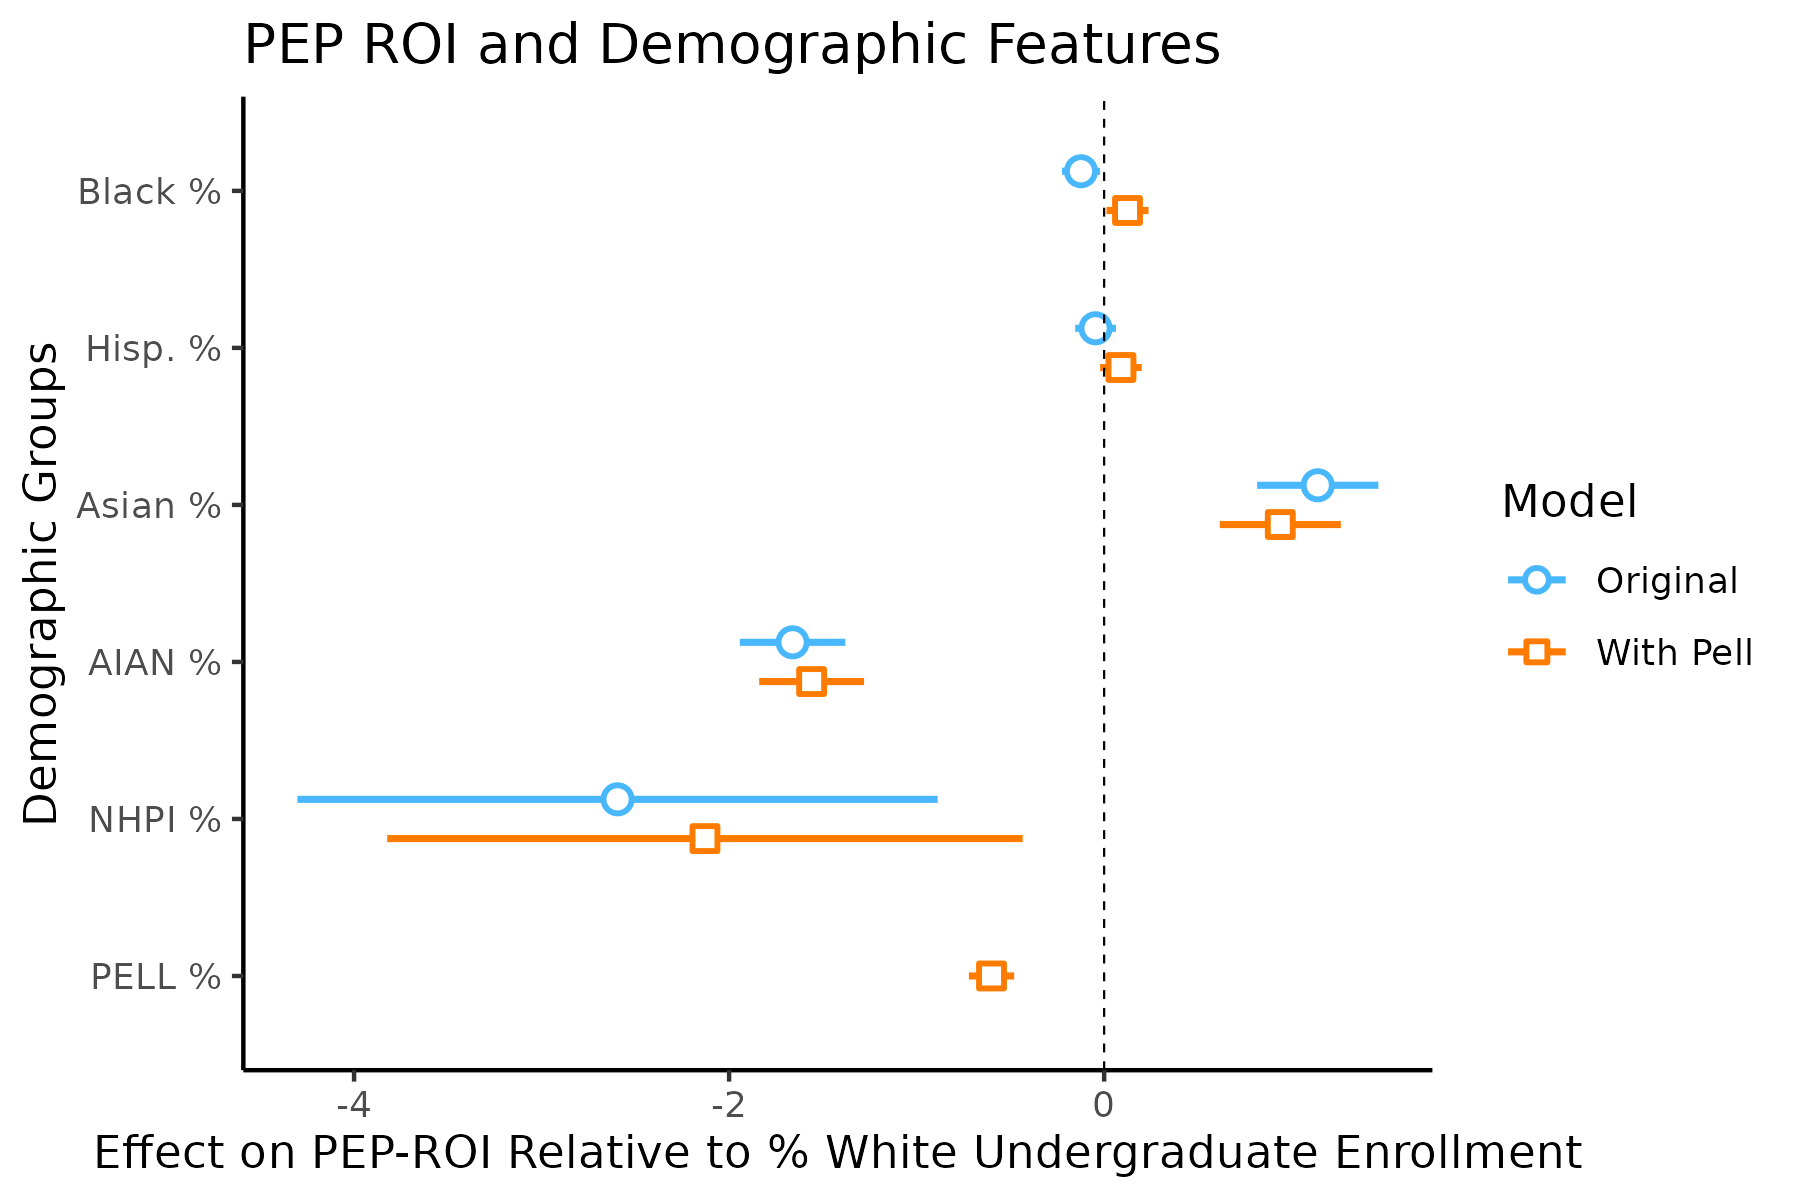
This plot (Figure 2) presents regression coefficients for demographic features predicting PEP-ROI, comparing two models: Original (blue) and With Pell (orange). The “Original” model took into account only the demographic makeup of each institution, while the “With Pell” model took into account both demographic makeup and the proportion of students who are recipients of the Pell Grant at an institution. Each point shows the estimated effect of a 1 percentage point increase in demographic composition on PEP-ROI, relative to White undergraduate enrollment. Error bars indicate confidence intervals.
- A higher proportion of Asian students is associated with significantly positive effects on PEP-ROI in both models.
- Higher proportions of American Indigenous and Alaskan Native (AIAN), Native Hawaiian and Pacific Islander (NHPI), and Black students are associated with negative effects, particularly NHPI, which shows large uncertainty due to a small sample size.
- When Pell eligibility is added, effect sizes are attenuated, suggesting that Pell status mediates the relationship between the demographics of an institution and ROI.
- The variable for the proportion of Pell recipients (PELL %) at an institution has a negative coefficient, suggesting that institutions serving more Pell-eligible students tend to see lower PEP-ROIs, holding other factors constant.
This plot underscores how student body composition relates to institutional returns and suggests that socioeconomic factors (like Pell eligibility) partially account for racial/ethnic disparities.
Postsecondary Value Commission ROI Frameworks
These frameworks have two parts: an institution’s ROI score and a binary indicator for whether the school meets a certain threshold.
Postsecondary Value Commission: Threshold 0
Calculation Framework
Minimum Economic Return: “A student meets this threshold if they earn at least as much as a high school graduate plus enough to recoup their total net price plus interest within ten years.” (p. 40)
An institution meets Threshold 0 if:
10 * (Median salary after higher education degree) ≥ 10 * (Median state-level salary for high school degree earners) + (Average Net Price * Average Time to Credential)
Table of Results
Regression Models
We estimated how controlling for the share of Pell Grant recipients affects the likelihood that different Minority‑Serving Institution (MSI) types meet Threshold 0.
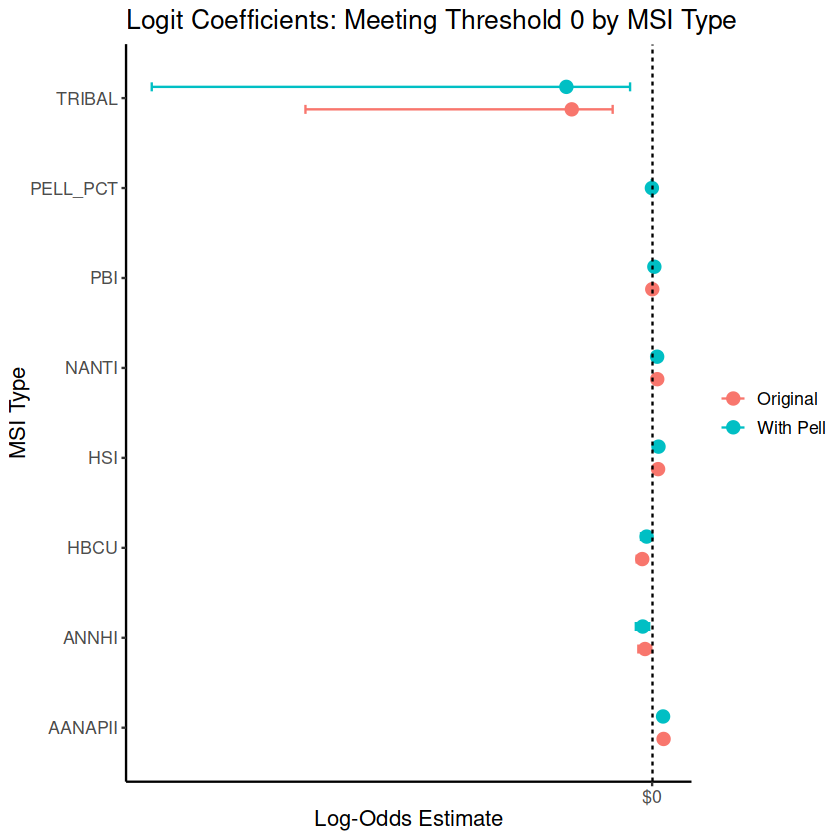
Tribal Colleges stand out as being far less likely to meet Threshold 0 than other institutions. This holds true across both the reduced model and model with Pell Grant percentage. The difference is large and meaningful, suggesting that these colleges may be facing major challenges.
Other types of MSIs (such as HBCUs, HSIs, PBIs, etc.) don’t show strong differences from the baseline; their chances of meeting the benchmark are about the same as non-MSI institutions.
These findings point to possible systemic barriers or underfunding facing Tribal Colleges specifically.
Next, we replace the MSI flags with continuous demographic shares—% Asian, % Black, % Hispanic, etc.—to see how each group’s concentration relates to earnings once Pell % is controlled.
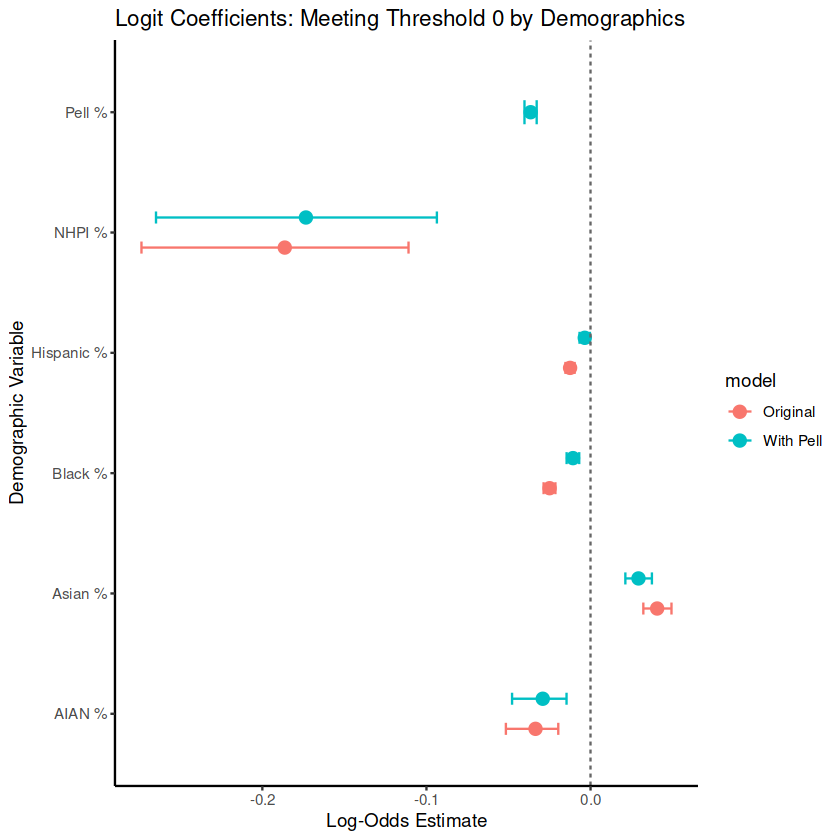
Colleges with higher percentages of Native Hawaiian or Pacific Islander (NHPI) and American Indian/Alaska Native (AIAN) students are less likely to meet the benchmark. These are significant negative effects, meaning they are not likely to be due to chance.
Schools with more low-income students (Pell Grant recipients) are actually more likely to meet the benchmark.
Other demographics (like Black and Hispanic percentages) show smaller or unclear effects. Asian student percentage has a small positive effect—colleges with more Asian students slightly outperform others on this measure.
Postsecondary Value Commission: Threshold 1
Calculation Framework
IHEP Earnings Premium: “A student meets this threshold if they reach at least median earnings in their field of study (or, if field of study data is unavailable, the median earnings for the institution’s predominant degree type).” (p. 40)
Our Implementation:
- Earnings Premium:
Median post‑enrollment earnings at institution (10 years after entry) - Meeting Threshold 1 (binary):
Earnings premium ≥ in‑state median earnings for people with bachelor’s degree
For 10-year post-enrollment earnings, we relied on the MD_EARN_WNE_P10 variable from College Scorecard. The median earnings for bachelor's degree holders by state were calculated using American Community Survey (ACS) data. We downloaded microdata from the ACS using IPUMS. We used the most recent 5-year pooled ACS data and selected the following variables for download: US2023C_SCHL (highest level of schooling completed), US2023C_PINCP (total personal income), and US2023C_STATE (FIPS state code). Income was then averaged across states.
Table of Results
Extensions
Future research could modify the current Meeting Threshold 1 variable to compare the earnings of individuals who attend a 2-year college with the median earnings for associate’s degree holders in the school’s state, since, under the current calculation, 2-year schools are being unfairly disadvantaged.
The revised calculation for Meeting Threshold 1 would thus be:
- Earnings ≥ β × (state bachelor’s earnings) + (1 - β) × (state bachelor’s earnings)
where β is a binary indicator for whether the school is a 4-year school.An alternative extension would be to more closely follow the original definition of the framework and incorporate field‑of‑study data. However, due to high missingness (approximately 78% across relevant variables), we opted to only use institution-level data. Using field-of-study-level information on a non-random, large subset of the data undermines the interpretability of the measure and biases the results in ways that are difficult to identify and account for.
Further Analysis of Threshold 1
Regression Models
Next, we estimate how controlling for the share of Pell Grant recipients shifts the relative earnings premium across different Minority‑Serving Institution (MSI) types.
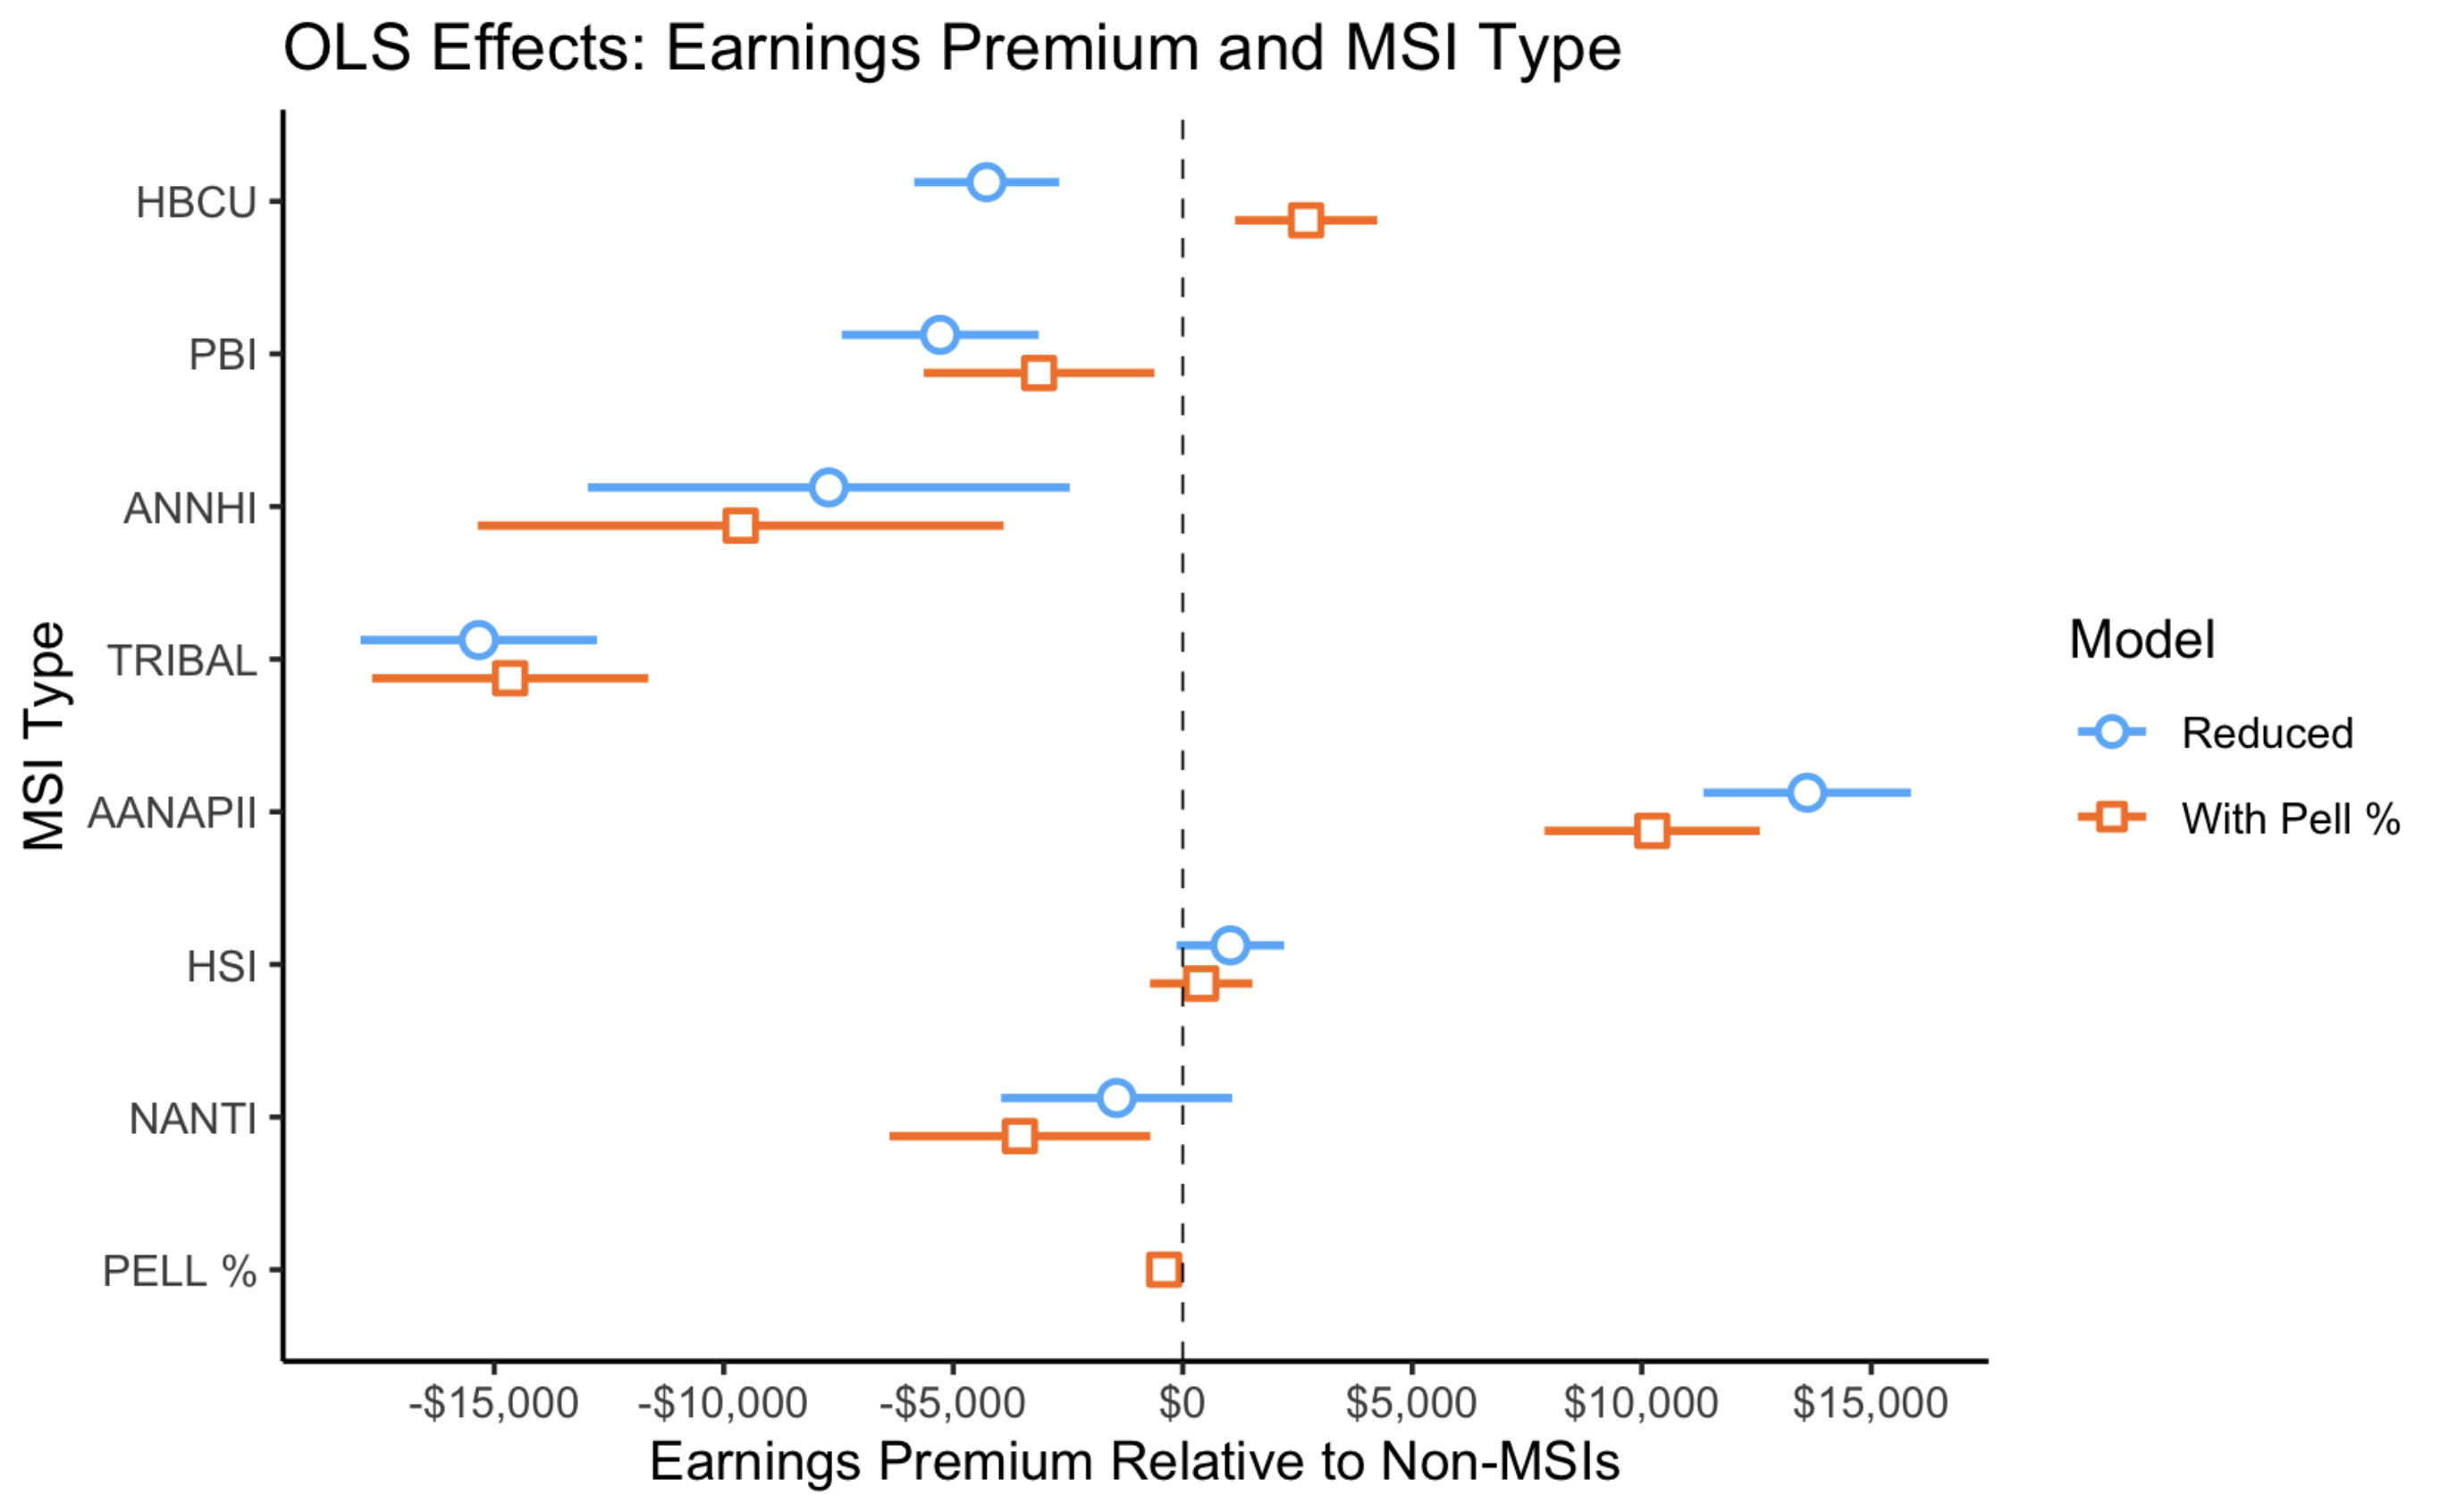
- HBCUs: Move from underperforming to outperforming non‑MSI schools (≈ +$7,000) once Pell % is included.
- PBI: Also see a noticeable improvement.
- HSI & TCU: Remain largely unchanged.
- ANNHI, NANTI, AANAPII: Experience a modest decrease (≈ $2,000).
Overall, the impact of controlling for Pell % is heterogeneous. Because MSI classification is based on whether each subgroup exceeds a fixed threshold (typically ≥ 25 %), using continuous demographic percentages could yield more nuanced insights than a simple binary flag.
Regression Model with Demographics
We replace the MSI flags with continuous demographic shares—% Asian, % Black, % Hispanic, etc.—to see how each group’s concentration relates to earnings once Pell % is controlled.
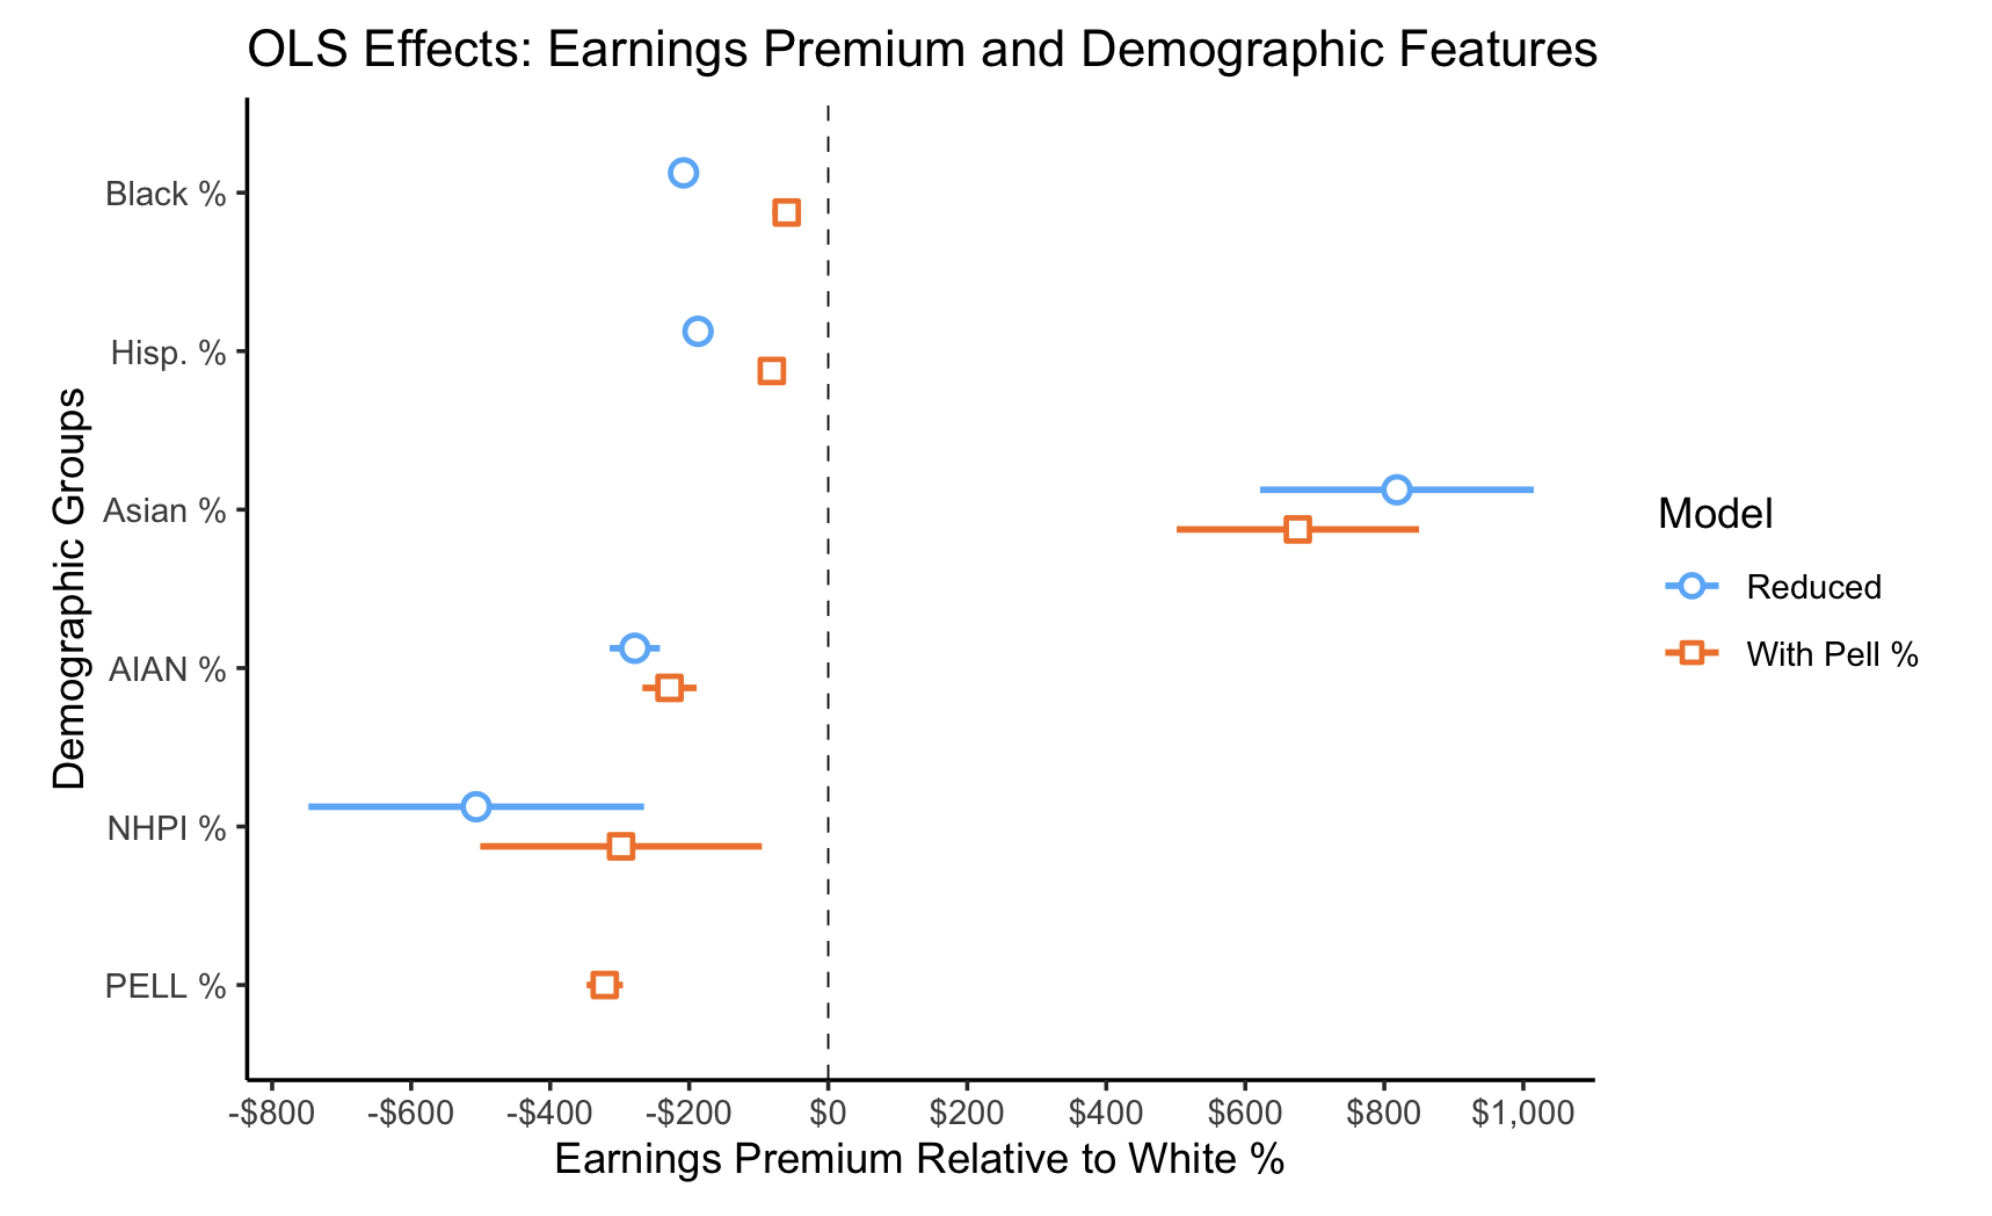
Despite the smaller x-axis in this new figure, the effects of demographic percentages are still quite substantial. For example, a 1% increase in Pell students is associated with a $320 decrease in expected earnings. Assuming an approximately linear relationship (as tests of curvilinear models suggest the linear model provides a reasonably good fit), a school with 30% more students with Pell Grants is associated with students earning nearly $10,000 less on average ten years after enrollment.
Aside from Asian students, controlling for Pell % amplifies the positive association between each demographic share and earnings relative to the White student baseline. These findings provide strong evidence that this ROI measure disadvantages schools with higher minority populations by confounding return on investment with the effects of prior socioeconomic status.
Logit Regression Model with Demographics
We then modeled the log-odds of meeting threshold 1 as a function of demographic features using logit regression. See the Postsecondary Value Commission section for a review of how to interpret the coefficients.
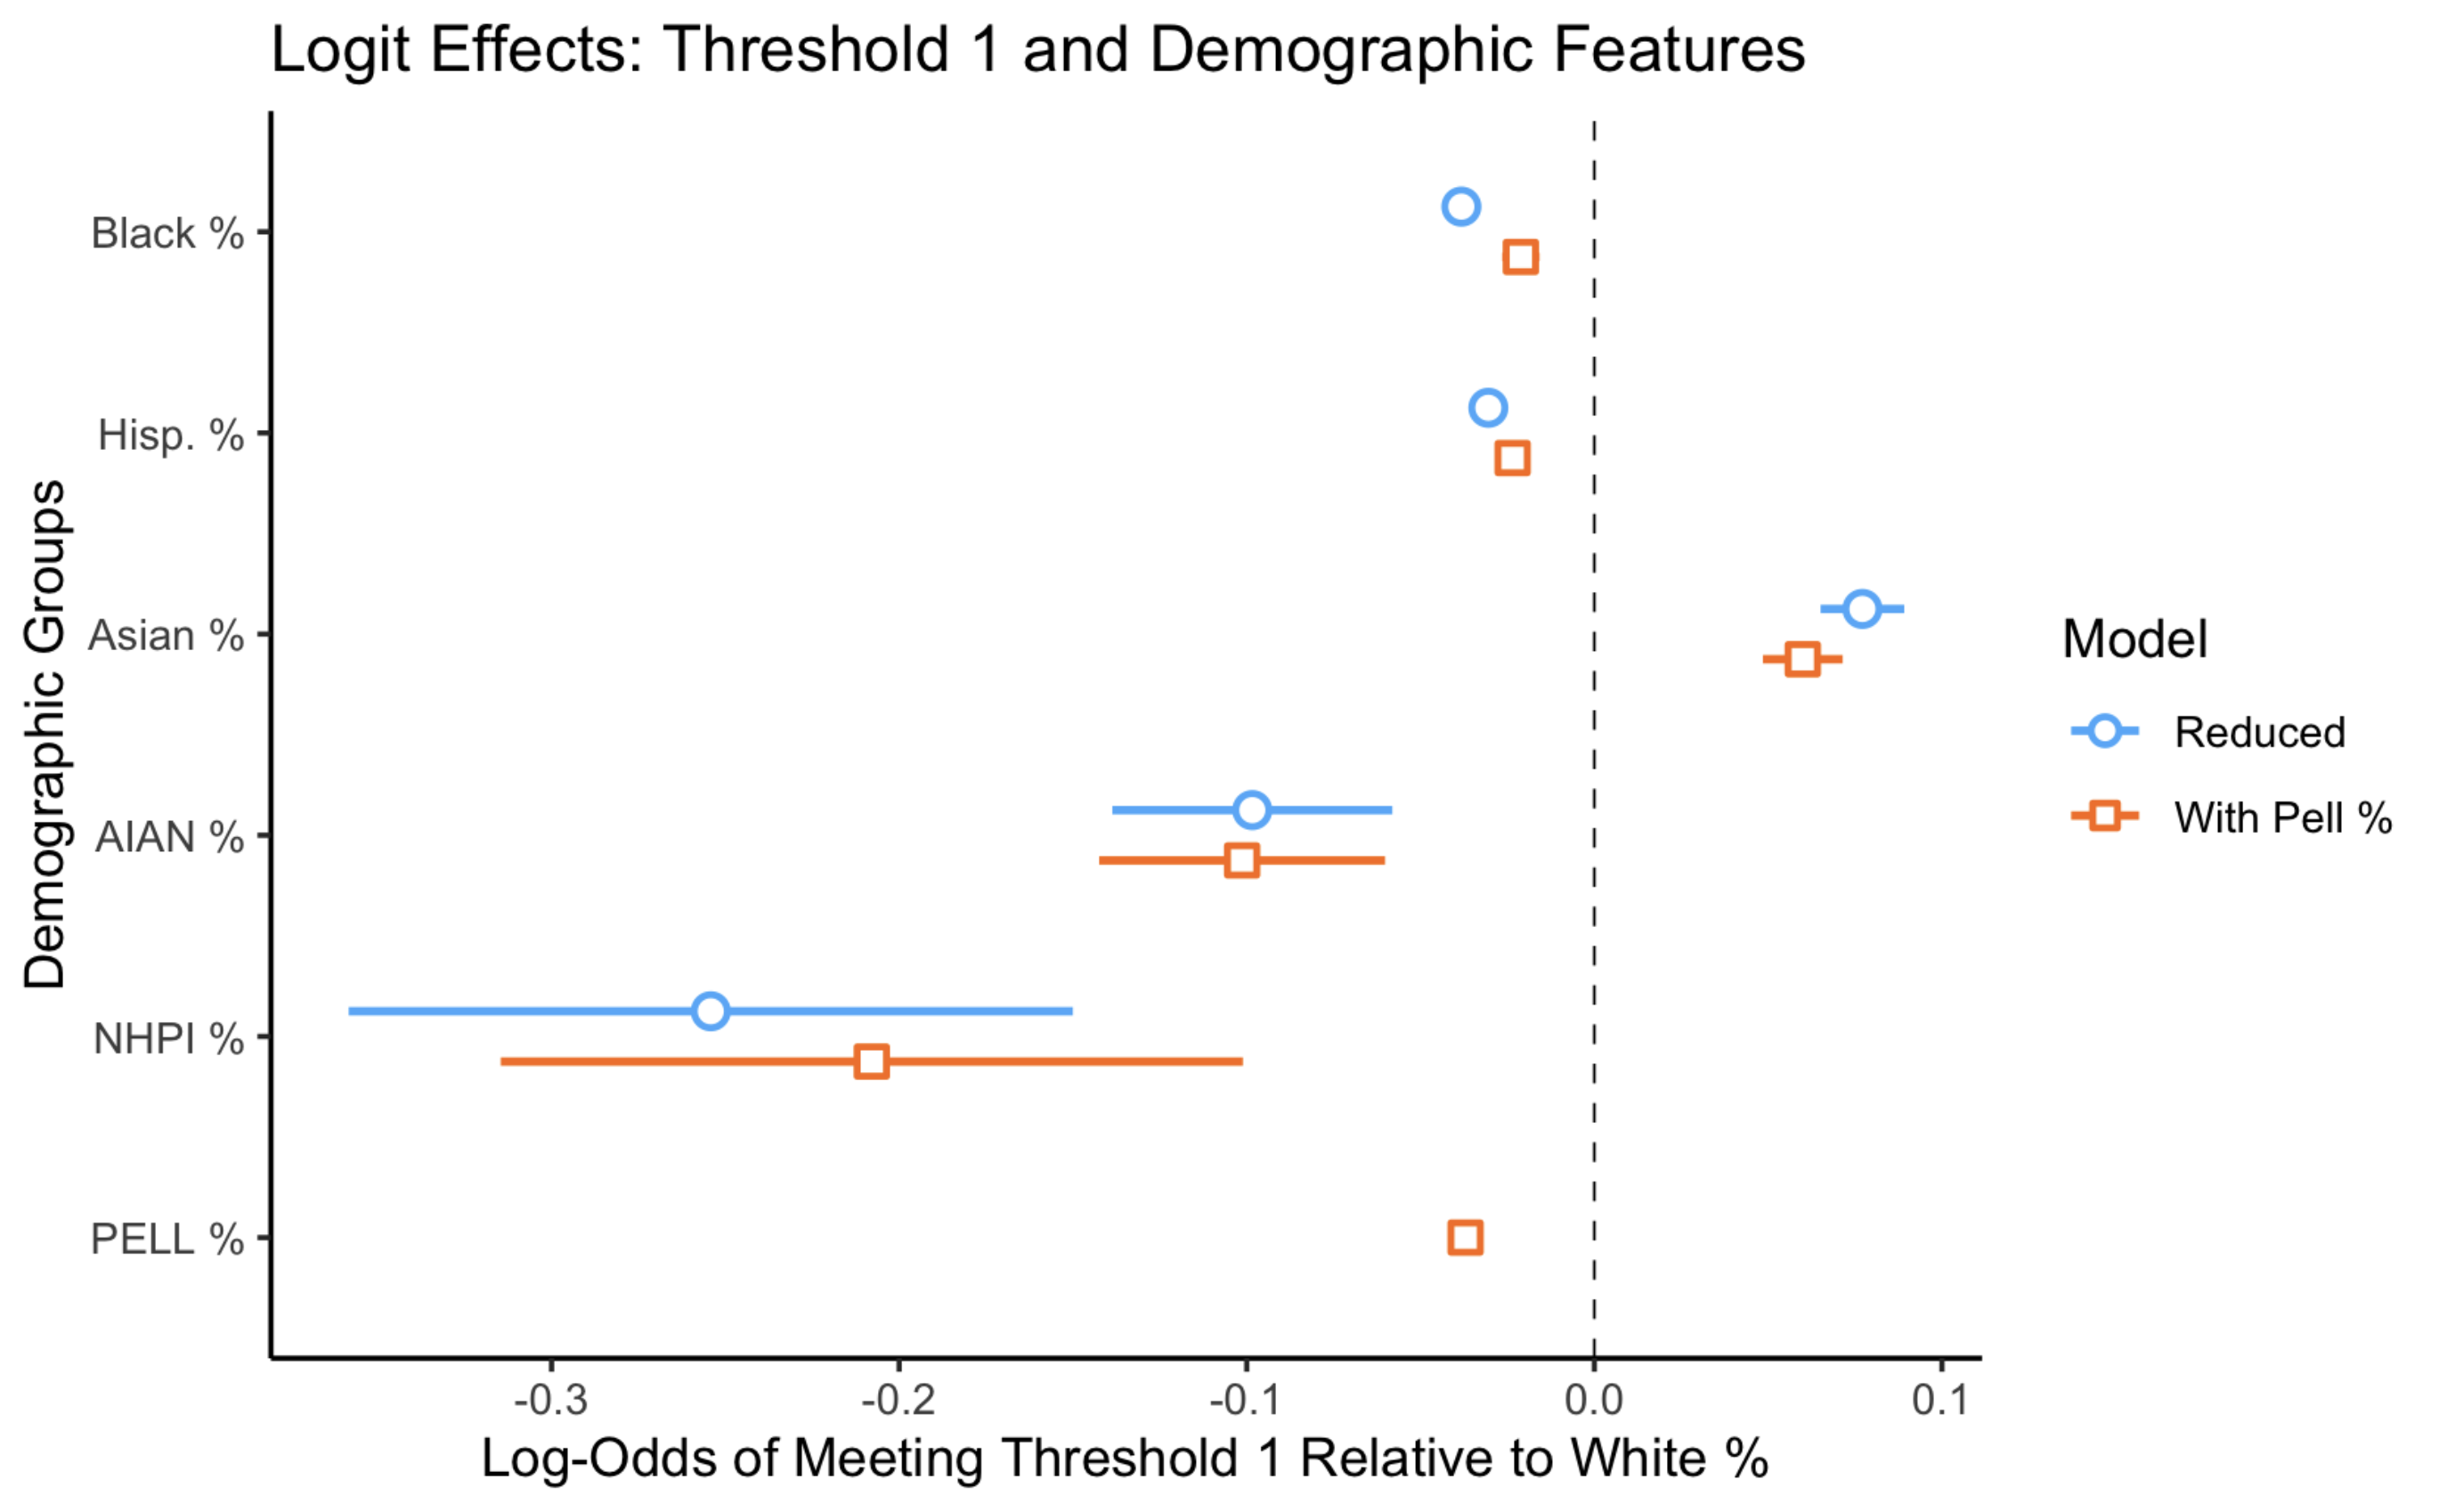
Overall, the effect of Black and NHPI percentage marginally improved after controlling for Pell percentage, the other effect of Asian percentage slightly decreased, and the effects of the variables stayed about constant.
Because the OLS model uses the full continuous ROI measure rather than a binary threshold, it retains more information and offers more interpretable estimates of the relationship between demographic composition and ROI. We therefore find its results to be most informative and useful.
Final Conclusions
Persistent racial disparities suggest that structural inequities continue to shape the economic value of higher education for students of color. Our analysis reveals critical disparities in postsecondary outcomes across different institutional types and student demographics. Tribal Colleges consistently underperform on key earnings benchmarks, even after accounting for socioeconomic factors, suggesting deep-rooted structural barriers that warrant targeted policy attention. While other Minority-Serving Institutions (MSIs) such as HBCUs and PBIs show improved performance when controlling for Pell Grant rates, this improvement is not uniform across all MSI types.
We examined the effects of both racial/ethnic demographic and MSI status on an institution’s ROI, using existing ROI calculation metrics. We found that regression models using continuous demographic data instead of binary MSI flags can provide a more nuanced understanding of how student composition relates to return on investment. Notably, institutions with higher shares of low-income and high proportions of certain minority student demographics tend to show lower post-enrollment earnings, even when educational inputs are similar. These findings underscore the importance of adjusting ROI metrics for socioeconomic and demographic factors to avoid unfairly penalizing institutions serving historically marginalized populations. Unfortunately, implementing such adjustments and determining an institution’s true ROI is a non-trivial causal problem that is difficult to contend with without rich student-level data and advanced modeling techniques. Due to the complexity of this problem, we do not propose any revised versions of the frameworks in this report. Our primary purpose has been to identify the ways in which existing ROI frameworks disadvantage certain marginalized groups. Nonetheless, as the Postsecondary Value Commission’s framework evolves, incorporating more granular data by field of study, degree type, and student background will be essential to ensuring a more equitable and accurate assessment of institutional value.
Discussion
We want to acknowledge the inherent limitations of research that assesses the value of institutions through a purely economic lens. This approach disregards the soft value provided by institutions of higher education, especially MSIs, which foster cultural preservation, the cultivation of identity, and the development of students’ social capital. Working with thresholds presents a unique problem of creating a binary, which can be an oversimplification of the true effect that they provide. Another limitation of our work was the availability of data: individual programs within institutions are often small enough that data must be privacy-suppressed. There is also a marked lack of data relating to external factors that affect performance on ROI frameworks, such as labor market conditions at the county level.
Despite these limitations, we believe that addressing these challenges presents an exciting opportunity for future research and development, and we are excited for the potential of enhancing existing ROI frameworks to better capture the true impact of higher education. Our research explores areas where future ROI models can adapt to better account for the effects of socioeconomic background and racial/ethnic composition on institutional ROI. Our findings show that controlling for socioeconomic factors significantly shifts institutional ROI outcomes, often narrowing or reversing apparent gaps between MSIs and non-MSIs. We also advocate for ROI measures to incorporate continuous demographic variables over binary institutional classifications, which better reflect the nuanced differences between institutions, both MSIs and non-MSIs.